
What is a system?
A system is a collection of interrelated components or elements that work together to achieve a common purpose or objective.
Systems can be physical or conceptual entities composed of parts that interact and influence each other with a hard or arbitrary boundary.
Systems exhibit emergent properties, which are characteristics or behaviours that arise from the interactions of the components but are not present in the individual components themselves. It’s not a cake until you mix and bake the ingredients.
An example of a hard boundary of a system would be your bike. A bike is a system of components that when assembled properly have the emergent property of being a bike. All the parts that are a bike and that are not a bike are quite obvious.
An arbitrary system boundary would be NHS Merseyside and Cheshire, because we decided where that boundary exists. I say ‘we’, but I personally had nothing to do with it. Now you’ve got the jist of things let’s see how you do with a mini quiz!
System Spotting

Is this a system?
Yes! A computer system is a hard boundary system!
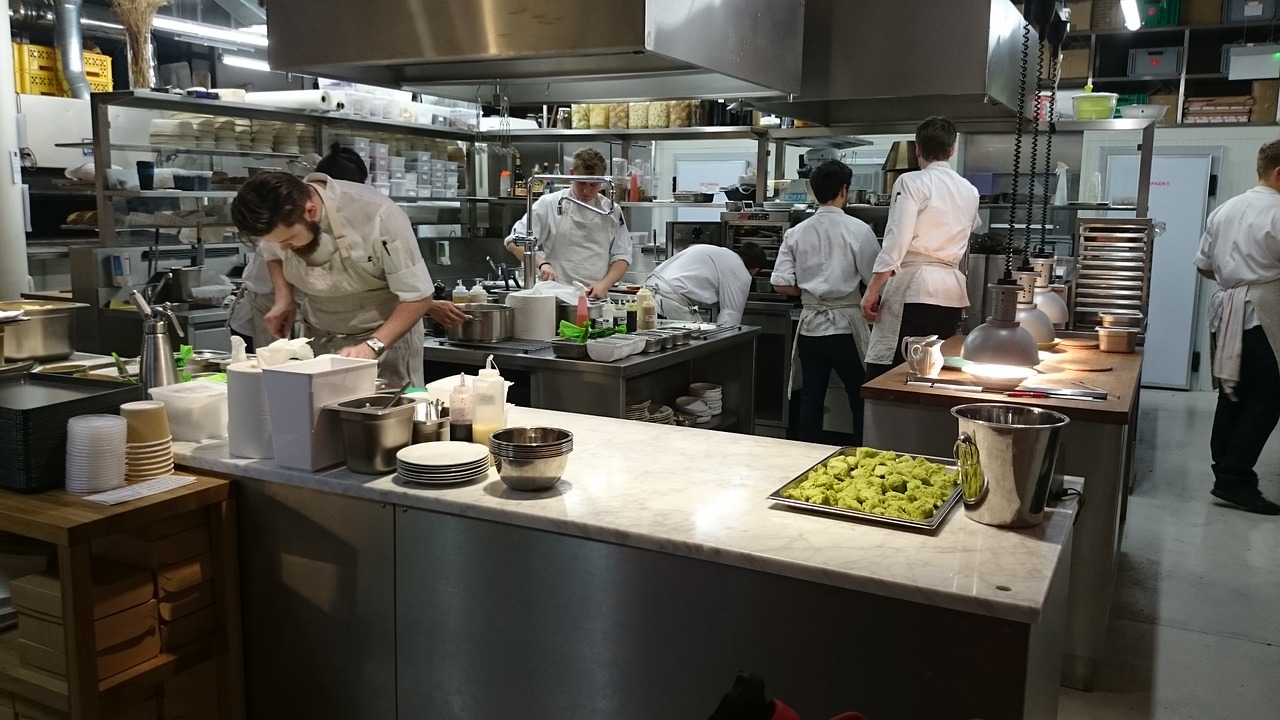
Is this a system?
Yes! Now there are people in the kitchen they are interacting with a common purpose.

Is this a system?
No! These things are not interacting with each other.

Are these systems?
Yes! Which means that you are in fact a system of systems!

Last one, but a tricky one. Is this a system?
Yes! You may be thinking, “But how are they interacting?” this one is on a longer time scale because if we left the fruit there long enough it would go mouldy and mushy as bacteria and fungi grew so it is a biological system! A mean one, I know, but hopefully you will have learned that…
Systems are everywhere!
Try “seeing beyond the object”
Pick any object around you and think about all the different systems that may have to exist for that thing to come into existence and be where it is now.
If you’re stuck, try a cup of coffee.
How did the beans get here?
How did the beans turn into liquid?
What went into making the cup?
What and who got it to you?
How do you change a complex system?
Quick answer: Together!
Longer answer: We try to understand how the system works now, and decide what we want the system to do in the future, re-framing the present and future. We find where in the system change can be made and then design interventions to make those changes. Then we wait and observe to see if those interventions made the change we wanted them to. These are the phases of Transition Design which aims to manage the transformation of a system from now to the desired future.
Irwin, T. (2018) The Emerging Transition Design Approach
Because we are not perfect, despite coming very close, there could be unexpected changes to the system from our intervention and so we must re-frame the system with those surprises. Some changes may happen almost instantly, others may take a long time. For instance, changing the rusty chain on my bike, I will see an almost instant improvement on my bike’s performance, but if I wanted to improve my overall health through running, one jog isn’t going to make that change.
By the time we see changes in our system, what we want the system to do may have changed as the world changed around it.
This kind of working and thinking means there is no right or wrong answer or solution that will be perfect for everyone forever, it’s simply aiming for better than what is now.
Everything big starts off small
We’re going to try one tool of Systems Design, Causal Loop Diagramming (CLD). This is a way of communicating a complex system in a non-linear way.
When we try to talk to each other about a complex system we could spend a long time saying, “…and then this affects that, but that affects this other thing, so we have to do this but that…” you get the idea. CLD lays that whole story out for us in a way we can identify elements that we may want to change and how all the interrelated components may be affected.
Looking at a full CLD for the first time is overwhelming, its like seeing all the words of a book laid out at once! But this section will teach you how to read it (come back to this diagram at the end see if it makes sense then), and then we’re going to be making our own!

‘An example of a dynamic map of an end-of-life system’ Report of the Lancet Commission on the Value of Death: bringing death back into life. Sallnow, L., et al. (2022)
So! First rule of CLD, all elements you add must be neutral.
For example an element could be ‘patient well-being’ because that can increase or decrease. But it can’t be ‘more patient well-being’ because that can’t increase or decrease.
Arrows and ‘+’ and ‘-’
If you want to say that if X increases, Y increases and if X decreases, Y decreases use a ‘+’
If you want to say that if X increases, then Y decreases and vice versa use a ‘-’
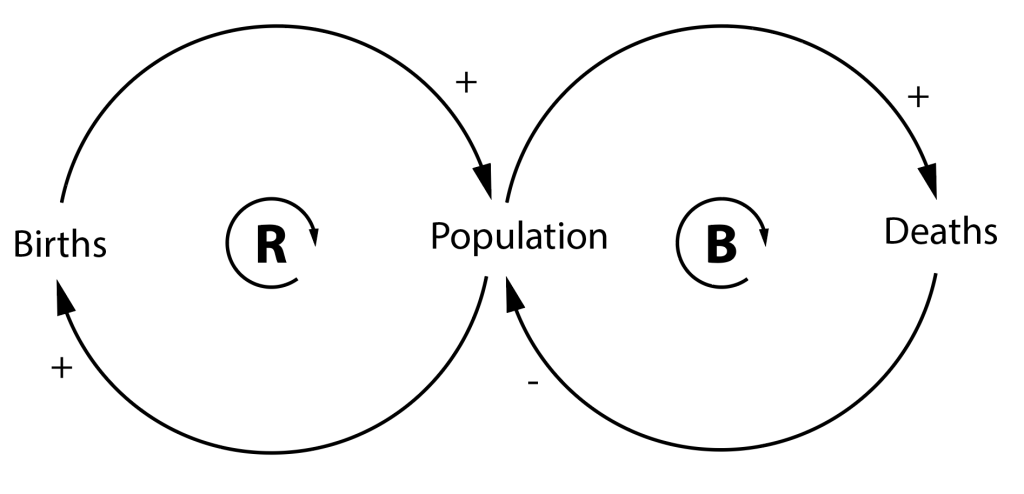
So here we have, as Births increase, Population increases and as Deaths increase, Population decreases.

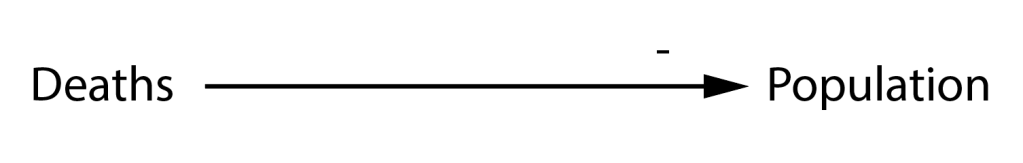
The plus and negative do not mean that it is a good or bad thing, it just shows the relationship between the elements. For example if increasing ‘understanding’ decreases ‘fear’ we would not say is a bad thing to happen but we would use a ‘-’ on the arrow.
Behaviours of a system
The more elements we add to a system, the likelihood that we discover that they connect back to each other and loop around increases. This is called a Behaviour of a system. There are two types of loops that appear in Causal Loop Mapping, Reinforcing Loops and Balancing Loops. In the partial system map shown you can see Rs and Bs with an arrow around them. Those show the different loops discovered.
This is a “Reinforcing Loop” and without any other interaction they would grow or decline exponentially over time.
Reading out loud gives us “as births increase the population increase, as the population increases births increase.”
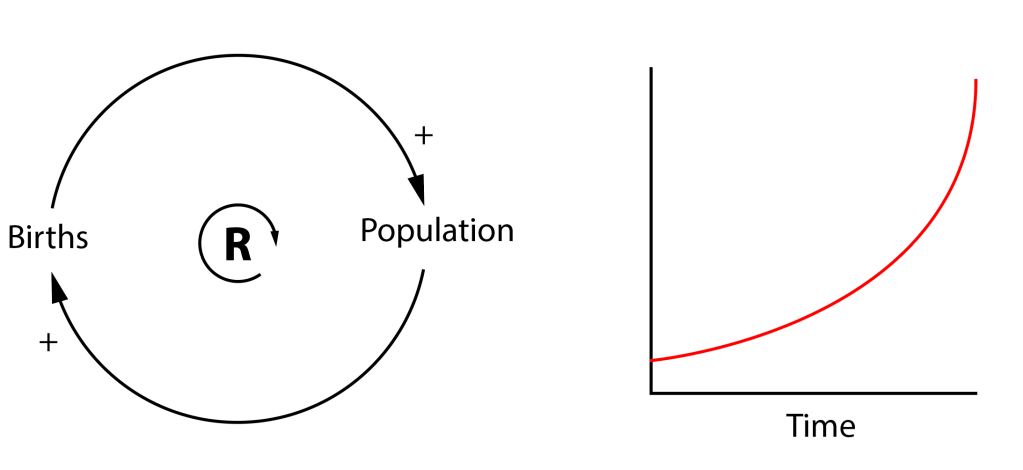
Give a try yourself, can you think of anything that keeps adding to itself?
For example: An increase in fund raising activities means an increase in funds, and an increase in funds means the more fund raising activities we can do!
This is a “Balancing Loop” and these elements will either plateau or oscillate over time keeping things generally balanced.
Reading this out loud gives us “as populations increase deaths increase, as deaths increase population decreases”
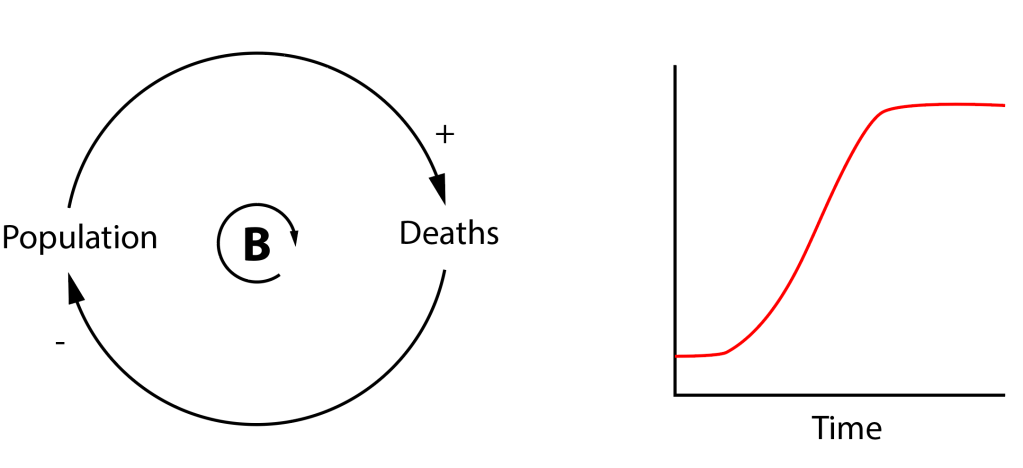
Give a try yourself, can you think of anything that balances out?
For example: As my hunger increase my food consumption increases, as my food consumption increases my hunger decreases
Because we had an element in common in both our two loops we can combine them to start making our map a little larger.
Now you’ve gotten through all of this go back to that first big map, and see if you can. do a better job at reading it now.
If you want some other examples and have a play around with your own here’s a fun free website Loopy!
Activities
This is where we start creating a huge map of the hospice system together. This can either be done online at Kumu.io which is a neat website and but I will have to teach you how to use it, it shouldn’t take too long, click here to send me an email about it OR there will be a map available to add to in the Research Hub just using post-it notes and pen (you won’t need any training there). Once we’ve got input from everyone we’ll close it up and find out what we have.
This is how things are looking so far
However, we have to be official with this so if you haven’t filled out a participant consent form for our online workshops yet please do so now and email it to me at a.tibbles@liverpool.ac.uk before continuing. If you’ve done it already, carry on!
Once that is done you can come and start creating the map
